We present the results of a new search for bright star-forming galaxies at z ≃ 7 within the UltraVISTA DR2 and UKIDSS UDS DR10 data, which together provide 1.65 deg2 of near-infrared imaging with overlapping optical and Spitzer data. Using a full photometric redshift fitting analysis to identify high-redshift galaxies and reject contaminants, we have selected a sample of 34 luminous (−22.7 < MUV < −21.2) galaxies in the redshift range 6.5 < z < 7.5. Crucially, the deeper imaging provided by UltraVISTA DR2 confirms all of the robust objects previously uncovered from the DR1 data by Bowler et al. (2012), validating our selection technique. Our new expanded galaxy sample includes the most massive galaxies known at z ≃ 7 with M⋆ ∼ 1010M⊙, and the majority are resolved in the ground-based imaging, consistent with a larger intrinsic size (r1/2 ≃ 1−1.5 kpc) than that found for less massive galaxies at comparable redshifts (a result supported by the HST WFC3/IR imaging of four of our galaxies). From our final robust sample, we determine the form of the bright end of the rest-frame UV galaxy luminosity function (LF) at z ≃ 7 using a 1/Vmax estimator. Our results now provide strong evidence that the bright end of the z = 7 LF does not decline as steeply as predicted by the Schechter function fitted to fainter data. We consider carefully, and exclude the possibility that this result could be a consequence of either gravitational lensing, or significant contamination of our high-redshift galaxy sample by active galactic nuclei (AGN). Rather our results favour a double power-law form for the galaxy LF at high redshift or, perhaps more interestingly, a LF which simply follows the form of the dark-matter halo mass function at bright magnitudes. This suggests that the physical mechanism which inhibits star-formation activity in massive galaxies (i.e. AGN feedback or some other form of “mass quenching”) has yet to impact on the observable galaxy LF at z ≃ 7, a conclusion supported by the estimated masses of our brightest galaxies which have only just reached a mass comparable to the critical “quenching mass” of M⋆ = 1010.2 M⊙ derived from studies of the mass function of star-forming galaxies at lower redshifts.
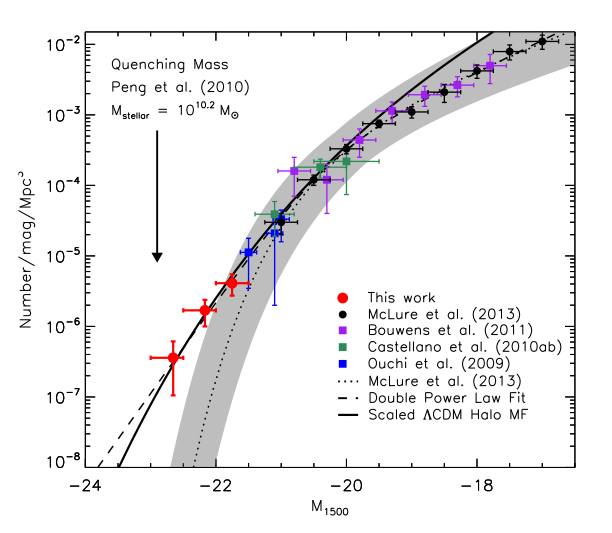
The z = 7 UV (∼ 1500 ̊A) luminosity function show- ing a scaled ΛCDM halo mass function (solid black line). The results from our sample of galaxies from the UltraVISTA DR2 and UDS fields are shown as the red filled circles. The best-fitting Schechter function at z = 7 from McLure et al. (2013) is plotted as the dotted black line, and the best-fitting double power law to our data points and those from McLure et al. (2013) is shown as the dashed line. The one-sigma confidence limit on the Schechter function parameters (M⋆,φ⋆ and α) is shown as the grey shaded region. We highlight the quenching mass derived by Peng et al. (2010) with an arrow, after converting to a UV luminosity using the typical mass-to- light ratio displayed by our sample.
In the image we show the z = 7 UV (∼ 1500 ̊A) luminosity function show- ing a scaled ΛCDM halo mass function (solid black line). The results from our sample of galaxies from the UltraVISTA DR2 and UDS fields are shown as the red filled circles. The previous estimate calculated in Bowler et al. (2012) is shown as the open red circle, where the upper and lower circle represent the prediction if ten or one of the candidates were confirmed to be at z > 6.5. The best-fitting Schechter function at z = 7 from McLure et al. (2013) is plotted as the black line, and the best-fitting double power law is shown as the dashed line. By varying the Schechter function parameters (M ⋆ , φ⋆ and α), a one-sigma confidence limit on the best-fitting LF can be obtained, and is shown as the grey shaded region. Data points determined by McLure et al. (2013) and Bouwens et al. (2011) are shown extending to MUV = −17. The remaining data points were obtained from wider-area ground- based surveys by Ouchi et al. (2009a) and Castellano et al. (2010a,b). We highlight the quenching mass derived by Peng et al. (2010) with an arrow, after converting to a UV luminosity using the typical mass-to- light ratio displayed by our sample.
The most important result is that such galaxies appear to be more numerous than expected based on the standard (Schecter function) extrapolation from the number density of fainter z ~ 7 galaxies (as revealed by smaller-‐area deeper surveys with HST). Interestingly, this suggests the form of the bright–end of the galaxy luminosity function at z ~7 simply mirrors the high‐mass end of the dark‐matter halo mass function, and hence that the physical mechanism which produces the very steep decline in the number of luminous galaxies seen in the low‐redshift Universe has yet to impact on the galaxy population at z ~7 (within the first billion years of cosmic time).
For more details, the whole article can be found here