We present the results of a study investigating the rest-frame ultra-violet (UV) spectral slopes of redshift z ≈ 5 Lyman-break galaxies (LBGs). By combining deep Hubble Space Telescope imaging of the CANDELS and HUDF fields with ground-based imaging from the UKIDSS Ultra Deep Survey (UDS), we have produced a large sample of z ≈ 5 LBGs spanning an unprecedented factor of > 100 in UV luminosity. Based on this sample we find a clear colour-magnitude relation (CMR) at z ≈ 5, such that the rest-frame UV slopes (β) of brighter galaxies are notably redder than their fainter counterparts. Our determination of the z ≈ 5 CMR is well described by a linear relationship of the form: dβ = (−0.12 ± 0.02)dMUV, with no clear evidence for a change in CMR slope at faint magnitudes (i.e. MUV ≥ −18.9). Using the results of detailed simulations we are able, for the first time, to recover the intrinsic (i.e. free from noise) variation of galaxy colours around the CMR at z ≈ 5. We find significant (12σ) evidence for intrinsic colour variation in the sample as a whole. Our results also demonstrate that the width of the intrinsic UV slope distribution of z ≈ 5 galaxies increases from ∆β ≃ 0.1 at MUV = −18 to ∆β ≃ 0.4 at MUV = −21. We suggest that the increasing width of the intrinsic galaxy colour distribution and the CMR itself are both plausibly explained by a luminosity independent lower limit of β ≈ −2.1, combined with an increase in the fraction of red galaxies with increasing UV luminosity.
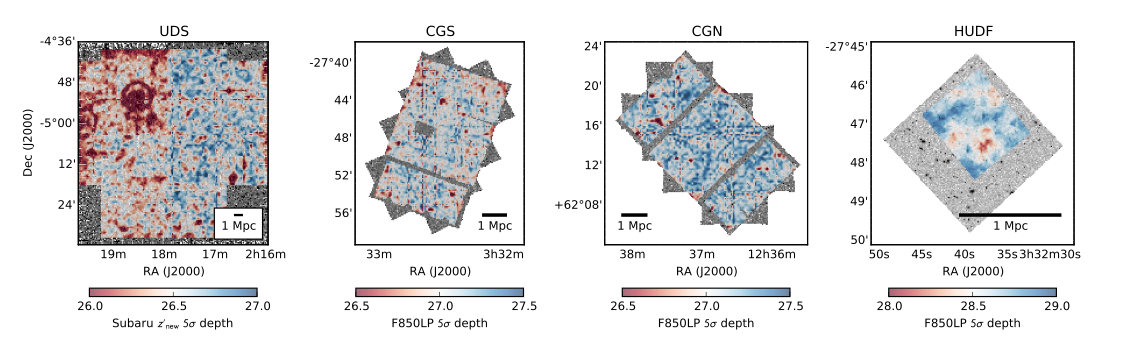
The four fields analysed in this study. In each, the grayscale image shows the z-band imaging in which the galaxies are detected, while the colour-map shows the local 5σ z-band depth from which SNR cuts are applied. Depths are computed at nodes of a 100 × 100 grid, based on each node’s 200 nearest source-free apertures (see Section 2.3 for a discussion). The footprint of each depth-map
defines our search area, i.e. the area in which imaging exists in 1 Mpc at z = 5.
In the main image above, we present the four fields analysed in this study. In each, the grayscale image shows the z-band imaging in which the galaxies are detected, while the colour-map shows the local 5σ z-band depth from which SNR cuts are applied. Depths are computed at nodes of a 100 × 100 grid, based on each node’s 200 nearest source-free apertures. The footprint of each depth-map defines our search area, i.e. the area in which imaging exists in 1 Mpc at z = 5.
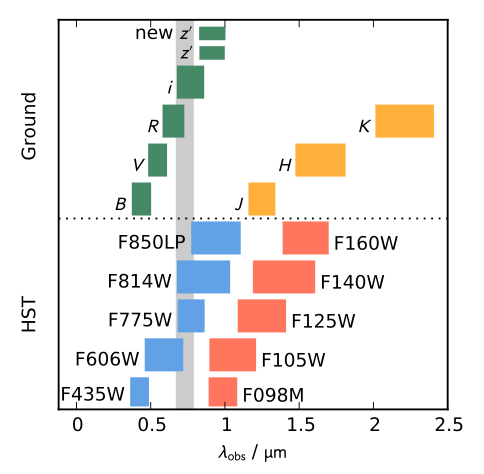
Fig.2: The photometric filter bandpasses for the images used in this work are shown by the coloured regions. Blue and red regions show the HST’s ACS and WFC3/IR filters, while green and yellow regions show the Subaru and UKIRT filters used in the UDS. The vertical, grey region denotes the wavelength range in which the 1216 ̊A Lyman break is observed at 4.5 < z < 5.5.
Crucially, in order to achieve maximum dynamic range in luminosity, this work relies on combining ground‐based and space‐based (HST) imaging, a key focus of AstroDEEP. The galaxy samples and the associated galaxy photometry was derived from the HUDF12 imaging in the Hubble Ultra Deep Field, the HST CANDELS imaging in the GOODS North and South fields, and the ground‐based imaging in the UKIDSS UDS field. All instruments and datasets that have been used for this work can be seen in Fig.2. Within each field, candidates were then detected in the z-band image and measured on all others images in fixed, circular apertures. Refined z-band signal-to-noise cuts were imposed at local thresholds for candidates in the HUDF, CGN, CGS and UDS. These thresholds were chosen as compromises between sample size and data quality, which is itself dependent on the homogeneity of depths and the number of bands probing the rest-frame UV. Candidate z ≈ 5 galaxies were then photometrically selected and this sample was used to constrain the colour– magnitude relation at z ≈ 5.
The paper presents two key results. First, it reaffirms and clarifies the form of the colour‐magnitude relation at z~5. Second, it presents the first statistically‐ significant evidence for a scatter in intrinsic colour at the redshifts, a variation which appears to increase with increasing UV luminosity. The conclusion is that the increasing width of the intrinsic galaxy colour distribution and the CMR itself are both plausibly explained by a luminosity independent lower limit on UV slope, combined with an increase in the fraction of red galaxies with increasing UV luminosity. In Fig.3 you can see the width of the intrinsic colour distribution of galaxies at various luminosities.
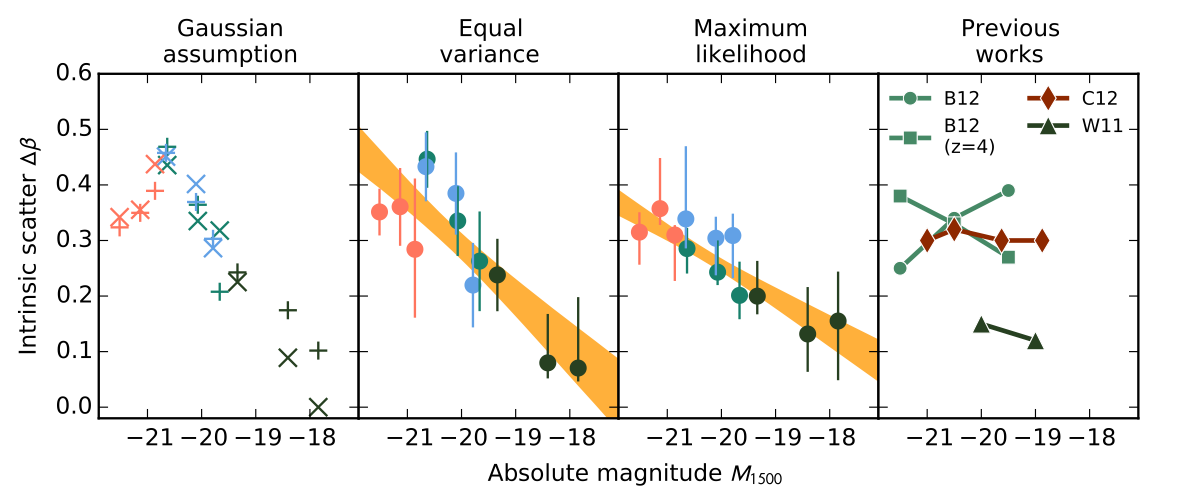
The width of the intrinsic colour distribution of galaxies at various luminosities. The first three panels relate to each of our three test methods, as denoted by the panel title and described in Section 5. In the first panel, × marks show the results of our Gaussian assumption test, while + marks denote our simulation-free check results. In all cases, each field contributes three bins of equal occupancy. The points are coloured by field, as in Fig. 6: salmon=UDS, blue=CGS, green=CGN, dark=HUDF. The error bars each enclose 68% of the total p(∆β) where applicable. In each case, the yellow regions show the 1σ error limits of a linear fit to the measurements, weighted by the errors on ∆β. In all three tests, brighter galaxies are drawn from a more varied intrinsic population than fainter galaxies. The final panel shows measurements drawn from the literature over narrower dynamic ranges, from Bouwens et al. (2012, B12), Wilkins et al. (2011, W11), and Castellano et al. (2012, C12).
For more details, the whole article can be found here